Showing posts with label Statistics. Show all posts

Tuesday, August 22, 2017

43. t-TEST

OBJECTIVE

Verify whether two groups are significantly different.


DESCRIPTION

There are three main applications of the t-test:
  • -          One-sample t-test: compare a sample mean with the mean of its population;
  • -          Two-sample t-test: compare two sample means;
  • -          Paired t-test: compare two means of the same sample in different situations (i.e. before and after a treatment).[1]

To perform a t-test, it is necessary to check the normality assumption (see 36.INTRODUCTION TO REGRESSIONS); however, the t-test tolerates deviations from normality as long as the sample size is large and the two samples have a similar number of elements. In the case of important normality deviations, we can either transform the data or use a non-parametric test (see Figure 40 in chapter 41.INTRODUCTION TO HYPOTHESIS TESTING).

An alternative to the t-test is the z-test; however, besides the normality assumption, it needs a larger sample size (usually > 30) and the standard deviation of the population.
Each of the three kinds of t-tests described above has two variations depending on the kind of hypothesis to be tested. If the alternative hypothesis is that the two means are different, then a two-tailed test is necessary. If the hypothesis is that one mean is higher or lower than the other one, then a one-tailed test is required. It is also possible to specify in the hypothesis that the difference will be larger than a certain number (in two-sample and paired t-tests).

After performing the test, we can reject the null hypothesis (there are no differences) if the p-value is lower than the alpha (α) chosen (usually 0.05) and if the t-stat value is not between the negative and the positive t-critical value (see the template). The critical value of t for a two-tailed test (t-critical two-tail) is used to calculate the confidence interval that will be at the 1 minus the α chosen (if we choose 0.05 we will have a 95% confidence interval).


ONE-SAMPLE T-TEST

With this test we compare a sample mean with the mean of the population. For example, we have a shampoo factory and we know that each bottle has to be filled with 300 ml of shampoo. To control the quality of the final product, we take random samples from the production line and measure the amount of shampoo.

One-Sample t-Test


Figure 43: Input Data of a One-Sample t-Test

Since we want to stop and fix the production line if the amount of shampoo is smaller or larger than the expected quantity (300 ml), we have to run a two-tailed test. Figure 43 shows the input data as well as the calculated standard deviation and sample mean, which is 295. A confidence level of 0.05 is chosen. We then calculate the t-critical value and p-value (the formulas can be checked in the template).

One-Sample t-Test

Figure 44: Results of a One-Sample t-Test

Since the p-value is lower than the alpha (0.05), we conclude that the difference in the means is significant and that we should fix our production line. The results also include the confidence interval of 95%, which means that we are 95% confident that the bottles are filled with a minimum of 292 ml and a maximum of 298 ml.


TWO-SAMPLE T-TEST

A practical example would be to determine whether male clients buy more or less than female ones.
First of all, we should define our hypothesis. In our example our hypothesis is that male and female clients do not buy the same amount of goods, so we should use a two-tailed test; that is, we do not infer that one group buys more than the other one. On the other hand, if we would like to test whether males buy more, in this case we would use a one-tailed test.
In the Excel complement “Data Analysis,” we choose the option “t-Test: Two-Sample Assuming Unequal Variances” by default, since, even if the variances are equal, the results will not be different, but if we assume equal variances, than we will have a problem in the results if finally the variances are not equal. We select the two-sample data and specify our confidence level (alpha, by default 0.05).

Two-Sample t-test Assuming Unequal Variances

Figure 45: Output of a Two-Sample t-test Assuming Unequal Variances

Since we are testing the difference, either positive or negative, in the output, we have to use the two-tailed p-value and two-tailed t-critical value. In this example the difference is significant, since the p-value is smaller than the chosen alpha (0.05).
Confidence intervals are also calculated in the template, concluding that we are 95% confident that women buy between 8 and 37 more products than men.


PAIRED T-TEST

We want to test two different products on several potential consumers to decide which one is better by asking participants to try each one and rate them on a scale from 1 to 10. Since we have decided to use the same group to test both products, we are going to run a paired two-tailed t-test. The alpha chosen is 0.05.

Paired t-Test

Figure 46: Output of a Paired t-Test

The results of the example show that there is no significant difference in the rating of the two products, since the p-value (two-tail) is larger than the alpha (0.05). The template  also contains the confidence interval of the mean difference, which in this case includes 0 since there is no significant difference.


TEMPLATE


[1] In some cases it is also possible to use two samples and match each component on a certain dimension.

Tuesday, April 25, 2017

37. PEARSON CORRELATION

OBJECTIVE

Find out which quantitative variables are related to each other and define the degree of correlation between pairs of variables.


DESCRIPTION

This method estimates the Pearson correlation coefficient, which quantifies the strength and direction of the linear association of two variables. It is useful when we have several variables that may be correlated with each other and we want to select the ones with the strongest relationship. Correlation can be performed to choose the variables for a predictive linear regression.

Pearson Correlation

Correlation Matrix

With the Excel Data Analysis complement, we can perform a correlation analysis resulting in a double-entry table with correlation coefficients (Pearson’s coefficients). We can also calculate correlations using the Excel formula “=CORREL().” The sign of the coefficient (Pearson correlation coefficient) represents the direction (if x increases then y increases = positive correlation; if x increases then y decreases = negative correlation), while the absolute value from 0 to 1 represents the strength of the correlation. Usually above 0.8 it is very strong, from 0.6 to 0.8 it is strong, and when it is lower than 0.4 there is no correlation (or it is very weak).

The figure above shows that there is a very strong positive correlation between X1 and Y and a strong positive correlation between X1–X3 and X3–Y. X3 and X4 have a weak negative correlation.


TEMPLATE


Wednesday, April 12, 2017

36. INTRODUCTION TO REGRESSIONS

Regressions are parametric models that predict a quantitative outcome (dependent variable) from one or more quantitative predictor variables (independent variable). The model to be applied depends on the kind of relationship that the variables exhibit. 

Regressions take the form of equations in which “y” is the response variables that represent the outcome and “x” is the input variable, that is to say the explanatory variable. Before undertaking the analysis, it is important that several conditions are met:
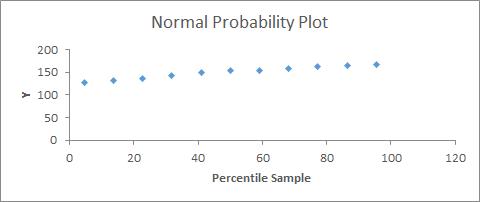
  • -          Y values must have a normal distribution: this can be analyzed with a standardized residual plot, in which most of the values should be close to 0 (in samples larger than 50, this is less important), or a probability residual plot, in which there should be an approximate straight line (Figure 31);
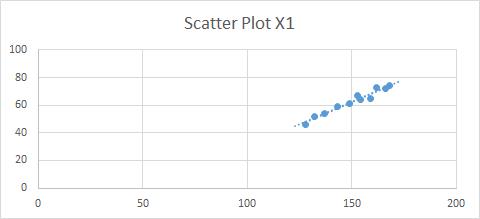
  • -          Y values must have a similar variance around each x value: we can use a best-fit line in a scatter plot (Figure 32);
  • -          Residuals must be independent; specifically, in the residual plot (Figure 33), the points must be equally distributed around the 0 line and not show any pattern (randomly distributed).


Normal probability plot

Figure 31: Normal Probability Plot

Best-Fit Line Scatter Plot

Figure 32: Best-Fit Line Scatter Plot

If the conditions are not met, we can either transform the variables[1] or perform a non-parametric analysis (see 47. INTRODUCTION TO NON-PARAMETRIC MODELS).

In addition, regressions are sensitive to outliers, so it is important to deal with them properly. We can detect outliers using a standardized residual plot, in which data that fall outside +3 and -3 (standard deviations) are usually considered to be outliers. In this case we should first check whether it was a mistake in collecting the data (for example a 200-year-old person is a mistake) and eliminate the outlier from the data set or replace it (see below how to deal with missing data). If it is not a mistake, a common practice is to carry out the regression with and without the outliers and present both results or to transform the data. For example, we may apply a log transformation or a rank transformation. In any case we should be aware of the implications of these transformations.

Standardized Residuals Plot with an Outlier

Figure 33: Standardized Residuals Plot with an Outlier

Another problem with regressions is that records with missing data are excluded from the analysis. First of all we should understand the meaning of a missing piece of information: does it mean 0 or does it mean that the interviewee preferred not to respond? In the second case, if it is important to include this information, we can substitute the missing data with a value:
  • -          With central tendency measures, if we think that the responses have a normal distribution, meaning that there is no specific reason for not responding to this question, we can use the mean or median of the existing data;
  • -          Predict the missing values using other variables; for example, if we have some missing data for the variable “income,” maybe we can use age and profession to for the prediction.

Check the linear regression template (see 38. LINEAR REGRESSION), which provides an example of how to generate the standardized residuals plot.


[1] To improve normality and variance conditions, we can try applying a log transformation to the response (dependent) variable. We can also use other types of transformations, but we must remember that the interpretation of the results is more complex when we transform our variables.

Thursday, March 16, 2017

35. DESCRIPTIVE STATISTICS

OBJECTIVE

Analyze the distribution of one or several variables in a data set.


DESCRIPTION

In statistical analysis the first step is to analyze the available data. This step is also useful to check for outliers or for the assumption of normality to use these data for a particular statistical model or test (see 36. INTRODUCTION TO REGRESSIONS). Since the analysis of these assumptions is included in the chapter introducing regressions, here I will focus on the descriptive statistics that are useful for describing numeric variables:


Statistic
Description
Mean
Arithmetic mean of the data
Standard Error
Represents the difference between the expected value and the actual value
Median
Central value (the value that divides the data in two – in the case of an even number of values, the median is the mean of the two central values)
Mode
Most frequent value
Standard Deviation
A measure of how values are spread out. Mathematically, it is the square root of the variance
Sample Variance
Average of the squared differences between each value and the mean (it is also a measure of how values are spread out)
Kurtosis
A measure of the “peakedness” and flatness of the distribution *. “0” means that the shape is that of a normal distribution, a flatter distribution has negative kurtosis, and a more peaked distribution has positive kurtosis
Skewness
A measure of the symmetry of the distribution. “0” means that the distribution is symmetrical. If the value is negative, the distribution has a long tail on the left, and if it is positive, it has a long tail on the right. As a rule of thumb, a distribution is considered to be symmetrical if the kurtosis is between 1 and -1
Range
The difference between the largest and the smallest value
Minimum
The smallest value
Maximum
The largest value
Sum
The sum of values
Count
The number of values

As shown in the template, these statistics can be calculated either using the Excel complement “Data Analysis” or using the Excel functions. The same is valid for creating a histogram, with which we can analyze the frequency of values and gain an idea of the type of distribution. In Figure 30 a sample including age data is represented in a histogram. On the right a box plot provides more information, dividing our data into quartiles (grouping the values into 4 groups containing 25% of the values). The plot shows that 50% of people are aged approximately between 33 and 46 years, while the rest are spread across a bigger range of ages (25% from 46 to 64 and 25% from 18 to 33).


Descriptive Statistics Graphs

Histogram and Box Plot

In the template we can see how the two graphs have been created. For the histogram we need to decide which age groups we want to use and fill a table with them. Then we can use the formula “=FREQUENCY” by selecting all the cells on the right of the age groups and pressing “SHIFT + CONTROL + ENTER,” and the formula will provide the frequencies. For the box plot we have to make some calculations and perform some tricks using a normal column chart if we have an older version than Excel 2016. The template and several tutorials can be consulted on the Internet.

Finally, we may have to identify which kind of distribution our data approximate the most (for example to conduct a Monte Carlo simulation). There is no specific method, but we can start by using a histogram and comparing the shape of our data with the shapes of theoretical distributions. The following URL provides 22 Excel templates with graphs and data of different distributions: http://www.quantitativeskills.com/sisa/rojo/distribs.htm.

If our variables are categorical, we can analyze them using a frequency table (count and percentage frequencies). We can also analyze the distribution of frequencies. In the case that our variables are ordinal, we should use the same method for categorical variables (for example if the categories are the answer to a satisfaction question with ordinal answers like “very bad,” “bad,” etc.). However, in some cases we may want to analyze ordinal variables with statistics used for numerical ones (for example, if we are analyzing answers to a question about the quality of services on a scale from 1 to 10, it can be interesting to calculate the average score, range, etc.).


TEMPLATE


* Even if Kurtosis has been traditionally explained in terms of peakedness/flatness it has been demonstrated that this is incorrect since it’s the tails that mostly account for it, not the central peak. https://www.ncbi.nlm.nih.gov/pmc/articles/PMC4321753/


Tuesday, December 6, 2016

45. A/B TESTING

OBJECTIVE

Test two or more items/objects and identify the one with the best performance.


DESCRIPTION

A/B testing is part of a broader group of methods used for statistical hypothesis testing in which two data sets are compared. Having defined a probability threshold (significance level), we can determine statistically whether to reject the null hypothesis or not. Usually, the null hypothesis is that there is no significant difference between the two data sets.
A/B testing is a randomized experiment with two variants (two-sample hypothesis testing), but we can also add more samples. The difference from multivariate testing is that in A/B testing only one element varies, while in the other test different elements vary and we should test several combinations of elements. These tests are used in several sectors and for different business issues, but nowadays they are quite popular in online marketing and website design.

A/B Testing of Conversion Rate

Output of Conversion Rate A/B Testing

Usually the steps to follow are:
  • -        Identify the goals: for example “improving the conversion rate of our website”;
  • -       Generate hypotheses: for example “a bigger BUY button will convert more”;
  • -       Create variables: in our example the element to be modified is the BUY button and the variation website can be created with a double-size BUY button;
  • -       Run the experiment:

o   Establish a sample size: depending on the expected conversion rate, the margin of error that is acceptable, the confidence level, and the population, the minimum sample size can be calculated (see the template);
o   The two versions must be shown to visitors during the same period, and the visitors must be chosen randomly (we are interested in testing the effect of a larger button; if we do not choose visitors randomly or show the two versions during different periods, the results will probably be biased);

-          Analyze the results:
o   Significance: depending on the significance level chosen for the test (usually 90%, 95%, or 99%), we can be X% confident that the two versions convert differently;
o   Confidence intervals: depending on the confidence level chosen, there will be a probable range of conversion rates (we will be X% confident that the conversion rate ranges from X to Y);
o   Effect size: the effect size represents the difference between the two versions.

The proposed template provides a simple calculator for the necessary sample size and for testing the significance of conversion rate A/B testing. However, a considerable amount of information about A/B testing is available online.[1] The template of chapter 44. TEST OF PROPORTIONS shows the same test with more statistical detail as well as the calculation of the mean difference confidence interval, while the A/B testing template presents confidence intervals for each mean of the two samples.

In the proposed example, the data are obtained using a web analytics tool (for example Google Analytics), but they can come from any experiment that we decide to run.


TEMPLATE


Wednesday, November 30, 2016

41. INTRODUCTION TO HYPOTHESIS TESTING

OBJECTIVE

Verify whether two (or more) groups are significantly different from each other, usually by comparing their means or medians.


DESCRIPTION
Generally speaking, statistical hypothesis testing concerns all the techniques that test a null hypothesis versus an alternative hypothesis. Although it also includes regressions, I will only focus on the testing performed on samples.
There are three main steps in hypothesis testing:
  • -          Definition: identify the problem, study it, and formulate hypotheses;
  • -          Experiment: choose and define the data collection technique and sampling method;
  • -          Results and conclusion: check the data, choose the most appropriate test, analyze the results, and make conclusions.


DEFINITION

The first step in hypothesis testing is to identify the problem and analyze it. The three main categories of hypothesis testing are:
  • -          to test whether two samples are significantly different; for example, after conducting a survey in two hotels of the same hotel chain, we want to check whether the difference in average satisfaction is significant or not;
  • -          to test whether a change in a factor has a significant impact on the sample by conducting an experiment (for example to check whether a new therapy has better results than the traditional one);
  • -          to test whether a sample taken from a population truly represents it (if the population’s parameters, i.e. the mean, are known); for example, if a production line is  expected to produce objects with a specific weight, it can be checked by taking random samples and weighting them. If the average weight difference from the expected weight is statistically significant, it means that the machines should be revised.

After defining and studying the problem, we need to define the null hypothesis (H0) and alternative hypothesis (Ha), which are mutually exclusive and represent the whole range of possibilities. We usually compare the means of the two samples or the sample mean with the expected population mean. There are three possible hypothesis settings:
  • -          To test any kind of difference (positive or negative), the H0 is that there is no difference in the means (H0: μ = μ0 and Ha: μ ≠ μ0);
  • -          To test just one kind of difference:
    • o   positive (H0: μ ≤ μ0 and Ha: μ > μ0);
    • o   negative (H0: μ ≥ μ0 and Ha: μ < μ0).


EXPERIMENT

The sampling technique is extremely important; it must be certain that the sample is randomly chosen (in general) and, in the case of an experiment, the participants must not know in which group they are placed. Depending on the problem to be testing and the test to be performed, different techniques are used to calculate the required sample size (check www.powerandsamplesize.com, which allows the calculation of the sample size for different kinds of tests).

RESULTS AND CONCLUSIONS
Once the data have been collected, it is necessary to check for outliers and missing data (see 36. INTRODUCTION TO REGRESSIONS) and choose the most appropriate test depending on the problem studied, the kind of variables, and their distribution. There are two main approaches to testing hypotheses:
  • -          The frequentist approach: this makes assumptions on the population distribution and uses a null hypothesis and p-value to make conclusions (almost all the methods presented here are frequentist);
  • -          The Bayesian approach: this approach needs prior knowledge about the population or the sample, and the result is the probability for a hypothesis (see 42. BAYESIAN APPROACH TO HYPOTHESIS TESTING).

DEPENDENT VARIABLE
SAMPLE CHARACTERISTICS (INDEPENDENT VARIABLES)
CORRELATION
1 SAMPLE
2 SAMPLES
SAMPLES > 2
INDEPENDENT
DEPENDENT
INDEPENDENT
DEPENDENT
DICHOTOMOUS
Test of proportions
McNemar test
Cochran's Q
Phi coefficient, contingency tables
CATEGORICAL
ORDINAL
MannWhitney U test
Wilcoxon signed-rank test
KruskalWallis test, Wilcoxon rank sum test
ScheirerRayHare test (two-way), Friedman test (one-way)
Spearman’s correlation
INTERVAL OR RATIO
One-sample z-test or t-test
Two-sample t-test
Paired t-test
One-way ANOVA
Repeated measure ANOVA
Pearson’s correlation
Two-way ANOVA

Summary of Parametric and Non-parametric Tests

Tests usually analyze the difference in means, and the result is whether or not the difference is significant. When we make these conclusions, we have two types of possible errors:
-          α: the null hypothesis is true (there is no difference) but we reject it (false positive);
-          β: the null hypothesis is false (there is a difference) but we do not reject it (false negative).

Possible outcomes of hypothesis testing
NOT REJECT NULL HYPOTHESIS
REJECT NULL
HYPOTHESIS
THE NULL HYPOTHESIS IS TRUE
1-α
Type I error: α
THE NULL HYPOTHESIS IS FALSE
Type II error: β
1-β

Possible Outcomes of Hypothesis Testing

The significance of the test depends on the size of α, that is, the possibility of rejecting the null hypothesis when it is true. Usually we use 0.05 or 0.01 as a critical value and reject the null hypothesis when α is smaller than the p-value (the critical value representing the probability, assuming that the null hypothesis is true, of observing a result at least as extreme as the one that we have (i.e. the actual mean difference).
It is important to remember that, if we are running several tests, the likelihood of committing a type I error (false positive) increases. For this reason we should use a corrected α, for example by applying the Bonferroni correction (divide α by the number of experiments).[1]
In addition, it is necessary to remember that, with an equal sample size, the smaller the α chosen, the larger the β will be (false negative).

If the test is significant, we should also compute the effect size. It is important not only whether the difference is significant but also how large the difference is. The effect size can be calculated by dividing the difference between the means by the standard deviation of the control group (to be precise, we should use a pooled standard deviation, but it requires some calculation). As a rule of thumb, an effect size of 0.2 is considered to be small, 0.5 medium, and above 0.8 large. However, in order contexts the effect size can be given by other statistics, such as the odds ratio or correlation coefficient.

Confidence intervals are also usually calculated to have a probable range of values to derive a conclusion in which there is, for example, 95% confidence that the true value of the parameter is within the confidence interval X‒Y. The confidence interval reflects a specific interval level; for example, a 95% interval reflects a significance level of 5% (or 0.05). When comparing the difference between two means, if 0 is within the confidence interval, it means that the test is not significant.


ALTERNATIVE METHODS

In the following chapters I will present several methods for hypothesis testing, some of which have specific requirements or assumptions (type of variables, distribution, variance, etc.). However, there is also an alternative that we can use when we have numerical variables but are not sure about the population distribution or variance. This alternative method uses two simulations:

  • -          Shuffling (an alternative to the significance test): we randomize the groups’ elements (we mix the elements of the two groups randomly, each time creating a new pair of groups) and compute the mean difference in each simulation. After several iterations we calculate the percentage of trials in which the difference in the means is higher than the one calculated between the two original groups. This can be compared with the significance test; for example, if fewer than 5% of the iterations indicate a larger difference, the test is significant with α < 0.05.

  • -          Bootstrapping (an alternative to confidence intervals): we resample each of our groups by drawing randomly with replacement from the groups’ elements. In other words, with the members of a group, we recreate new groups that can contain an element multiple times and not contain another one at all. An alternative resampling method would be to resample the original groups in smaller subgroups (jackknifing). After calculating the difference in means of the new pairs of samples, we have a distribution of means and can compute our confidence interval (i.e. 95% of the computed mean differences are between X and Y).


[1] There are also other methods that can be more or less conservative, for example the Šidák correction or the false discount rate controlling procedure.